


- Resource
- How To - Instructors
- Quizzes – View Quiz Statistics
Quizzes – View Quiz Statistics
Instructors can view and export quiz statistics and reports to a CSV or Excel file for data analysis. These files include all relevant quiz information, allowing you to query, sort, and evaluate the data offline, without needing to be connected to Brightspace.
View Quiz statistics
Select Activities > Quizzes > Statistics
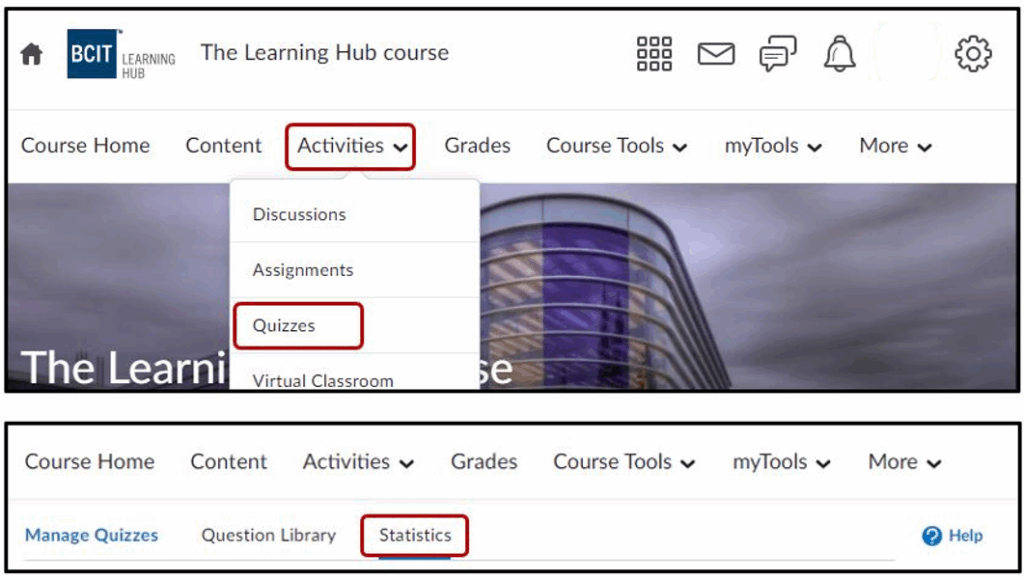
Select the Quiz from the list > On the View Statistics page, click the User Stats, Question Stats, and Question Details tabs to view statistics broken down by user and by question. Select Export to CSV or Export to Excel if you want to save the quiz’s statistics to your computer.

Note: The system exports the statistics only from the tab you are currently viewing.
Understanding User Stats
User Stats CSV and Excel files contain performance data by user, including the user’s Org Defined ID, username, first name, last name, quiz score, the value the quiz was graded out of, the user’s score as a percentage, and the class average.
Tip: You can create a column to calculate the median score on the quiz to consider the class’s performance from a different perspective. Use the formula <=median(x1:x5)> to calculate the median.

Understanding Question Stats
Question Stats CSV and Excel files contain data about the average score on questions by points and percentage.
The question title, text, bonus status, and difficulty level are included in the files so that data can be analyzed without referring back to the learning management system.
Tip: You can sort, query, hide, and delete data to help your analysis and create charts or graphs to visually represent trends.

Understanding Question Details
Question Details CSV and Excel files contain detailed information about each question in the quiz, including a list of all of the answers provided for each quiz attempt, how many users chose each possible answer, the total number of responses, and the average score on the question. Question Details reports can help you evaluate trends in answers and look for questions that were unclear or difficult for a number of users.
The question title, text, bonus status, and difficulty level are included in the CSV file so that data can be analyzed without referring back to the learning management system.
Tip: You can create a column that calculates the average score for all question attempts as a percentage by dividing the Average Score column by the Out Of column and multiplying by 100. Next, create a custom filter for the new Attempt Average column that displays only rows where the attempt average is less than 51%. This way you can quickly review questions that users struggle with and adjust grades or your lesson plans accordingly.

| Question Type | What is Exported |
|---|---|
| Multiple Choice | All possible answers and the number of responses for each answer. |
| True/False | All possible answers and the number of responses for each answer. |
| Long Answer | All the responses provided listed on separate rows. |
| Short Answer | The correct answer for each blank and an additional row for all other answers, and the number of responses for the correct answer versus other answers. |
| Multi-Short Answer | The correct answers for each blank and an additional row for all other answers, and the number of responses for the correct answer versus other answers. |
| Fill in the blanks | The correct answers and an additional row for other answers, and the number of responses for the correct answer versus other answers. |
| Muti-select | All possible answers and the number of responses for each answer. |
| Matching | All possible matches and the number of responses for each match. |
| Ordering | All answers in the order match and the number of responses for each match. |
| Arithmetic | Questions are broken down by results and units. Also, lists which users had both results and units correct, only results correct, only units correct, and neither correct. |
Related Posts
