


Kaltura Mediaspace – Analytics
Kaltura Mediaspace has two sets of Analytics, one for specific entries found inside My Media another that is repository focused and can only be accessed by Gallery/Channel managers.
Entry focused analytics
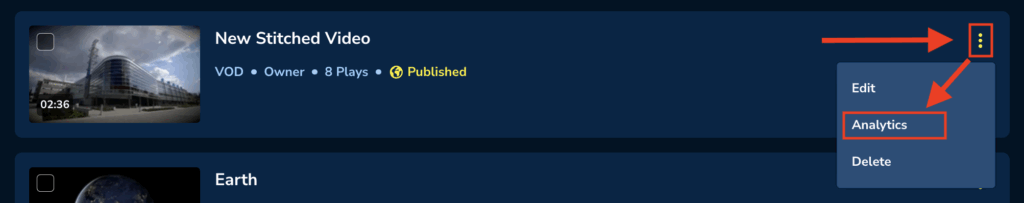
You can access the Analytics tool in Mediaspace that is specific to your owned entries by going into My Media, clicking on the three ellipses for the entry and then selecting the Analytics option.
This tool acts identically to the Kaltura Analytics tool found inside the Learning Hub. For a break down of the tool please click on the link below
Kaltura Analytics Tool
Repository focused analytics
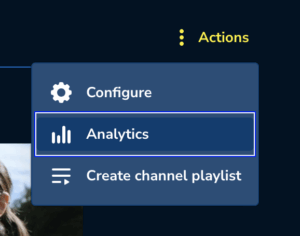
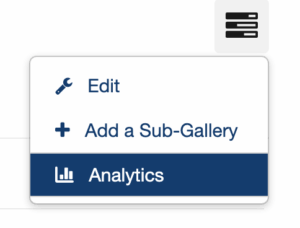
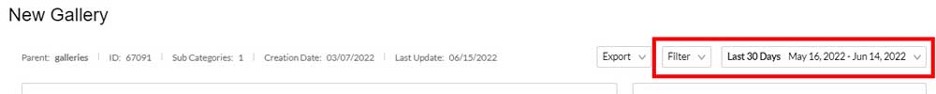
You can access the Analytics tool in Mediaspace that is specific to Galleries and Channels by clicking on the Actions Menu of the Gallery or Channel.
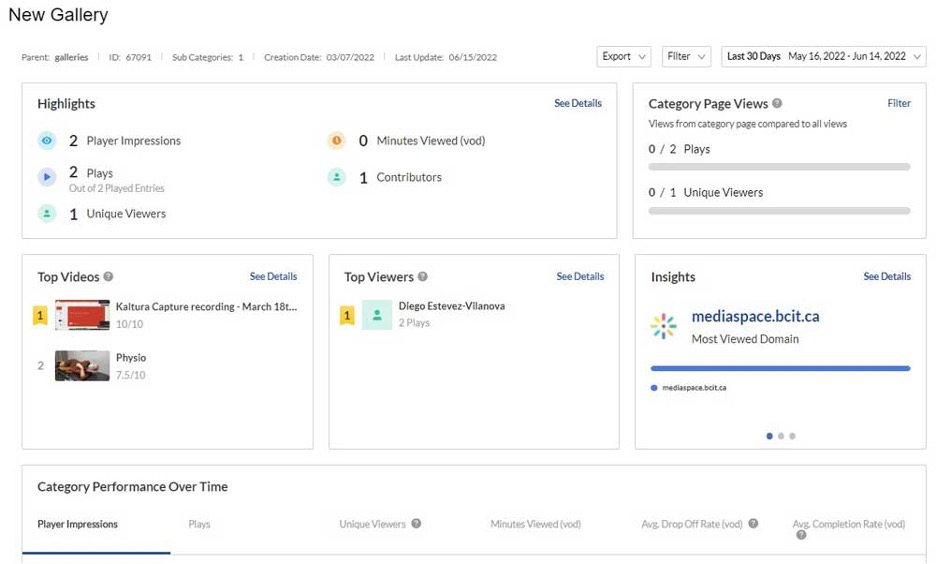
The analytics here are broken up into the following components:
- Highlights
- Category Page Views
- Top Videos
- Top Viewers
- Insights
- Category Performance Over Time
- Top Videos
- Top Countries
- Devices Overview
- Top Domains
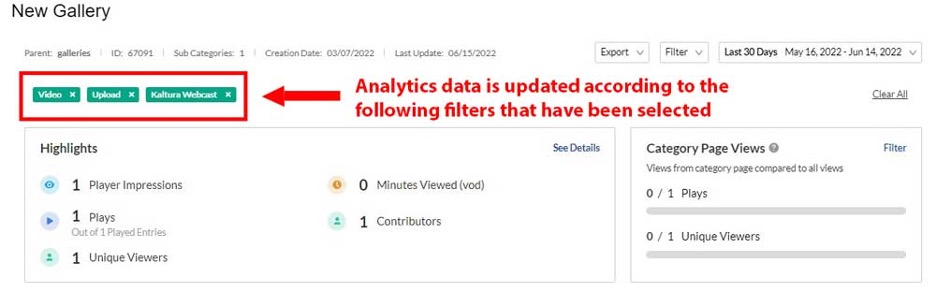
Data displayed across these components is directly influenced by the filtering options selected at the top of the screen.
Filtering Analytics Data
You can filter data by selecting the Filter and/or Last Days dropdown menus.
Filter Options
You can filter data according to:
- Media Type(s) – Video, Audio, and/or Images
- Entry Source – Source of published media (e.g., manually uploaded, Kaltura Capture, Express Capture)
- Playback Type(s) – VOD, DVR, Live, All Media Types
- Tags – Metadata tags associated with content
- Sub Categories – Info about associated Sub Galleries or Channels (only available when viewed from a Gallery with associated repositories)
- Domains/URL Pages – Where media was viewed
- Country/Region/City – Location of viewers
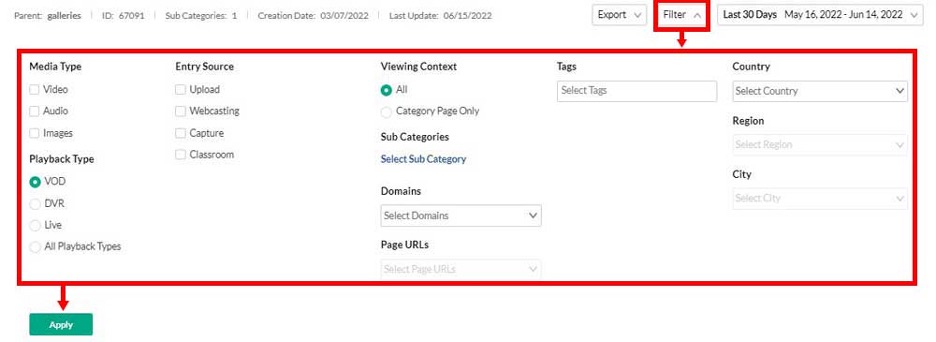
Once specified, click Apply to filter the data.
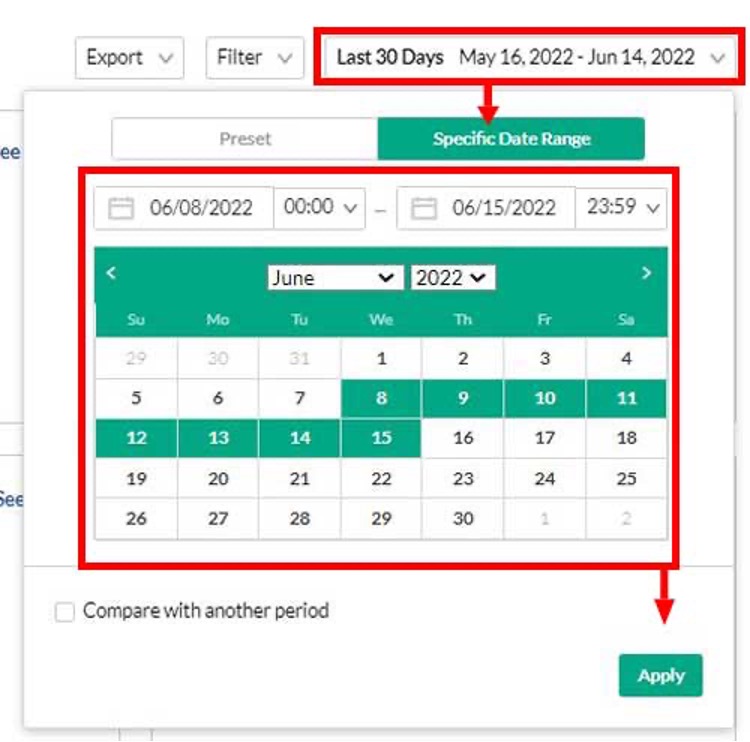
Last Days
Allows filtering by date range using:
- Preset – Choose from predefined ranges under Since, Last, and Current
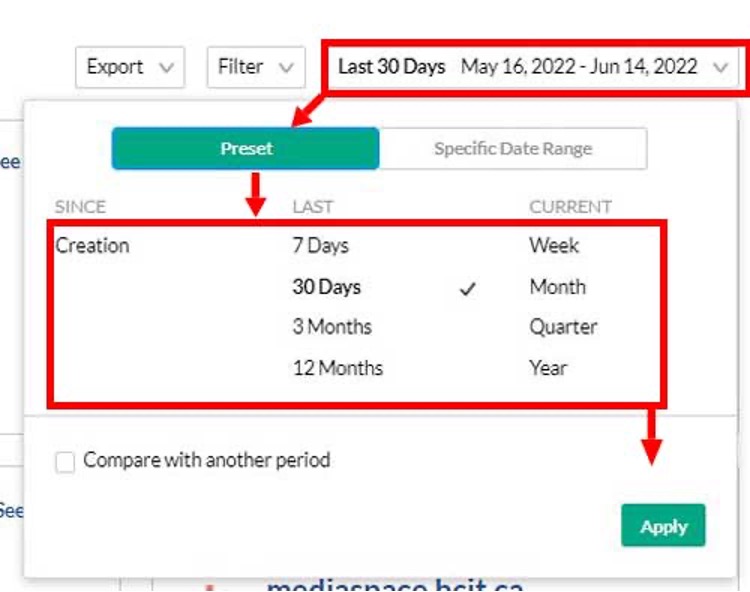
- Specific Date Range – Manually select a date range
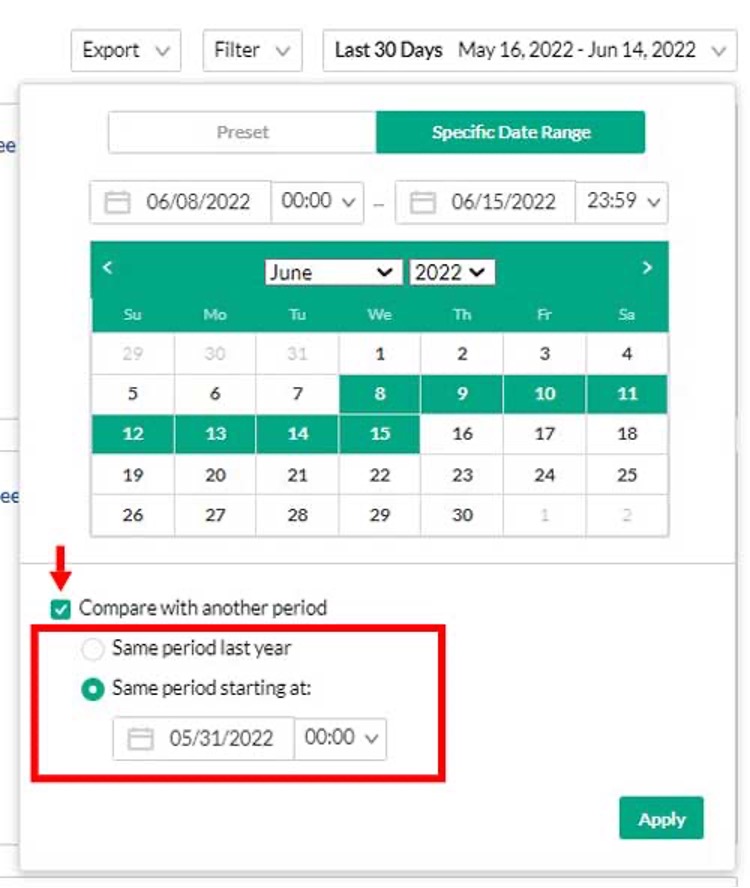
You can also tick Compare with another period to compare with:
- The same range from the previous year
- The same number of days starting from a selected date
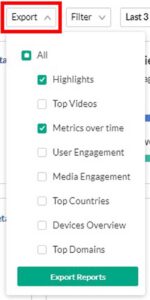
Exporting Analytics Data
Click Export and select the desired components. Then click Export Reports to receive an Excel spreadsheet via BCIT email.
Analytics Components
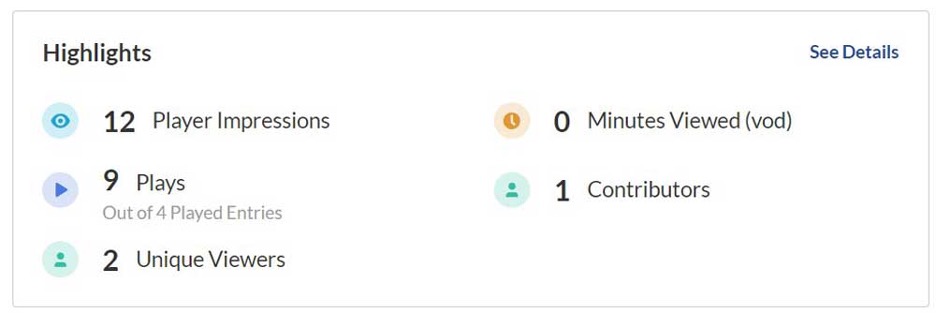
Highlights
Displays five key metrics:
- Player Impressions – Counted each time a media player loads
- Minutes Viewed – Total minutes watched across all entries
- Plays – Number of times users clicked play
- Unique Viewers – Number of viewers with a unique BCIT A0 number
- Contributors – Number of repository members who published at least one video
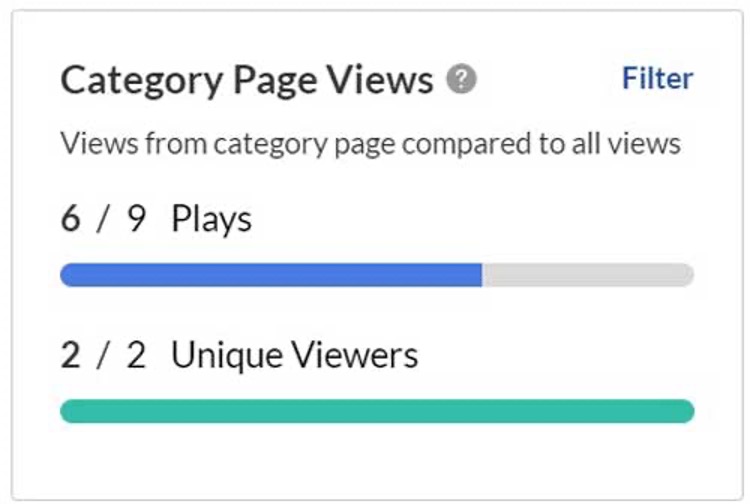
Category Views per Page
Compares views from within the repository vs. external sources (e.g., embedded on other sites).
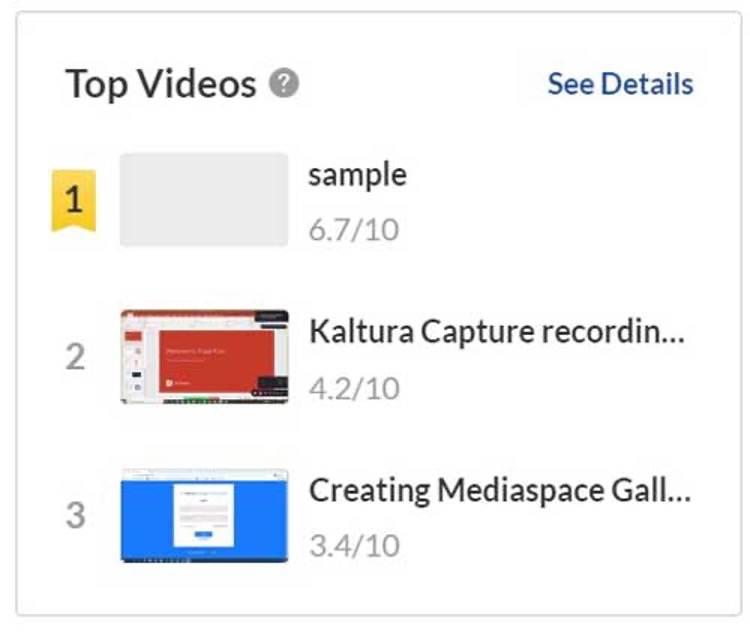
Top Videos
Displays the top 3 videos based on Kaltura’s proprietary scoring algorithm.
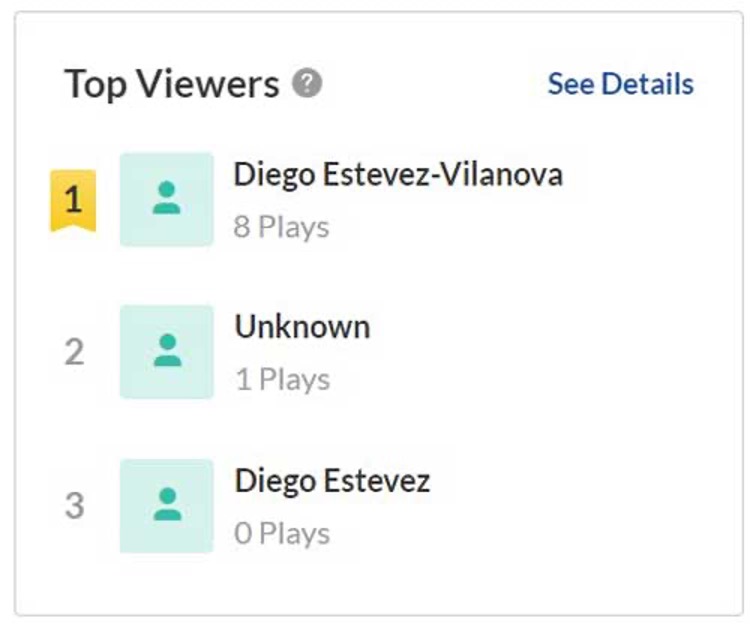
Top Viewers
Shows names of the top 3 users who clicked play most frequently.
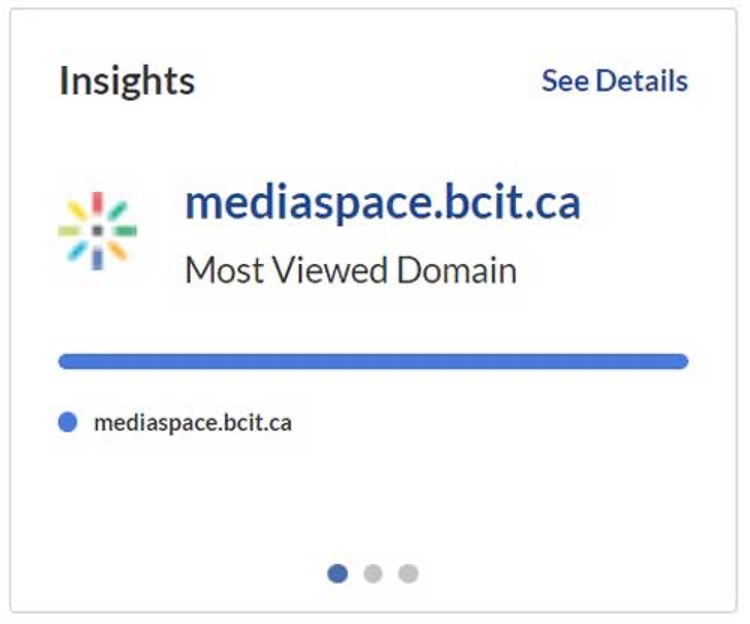
Insights
Summarizes top results from:
- Top Domains
- Top Locations
- Device Overview
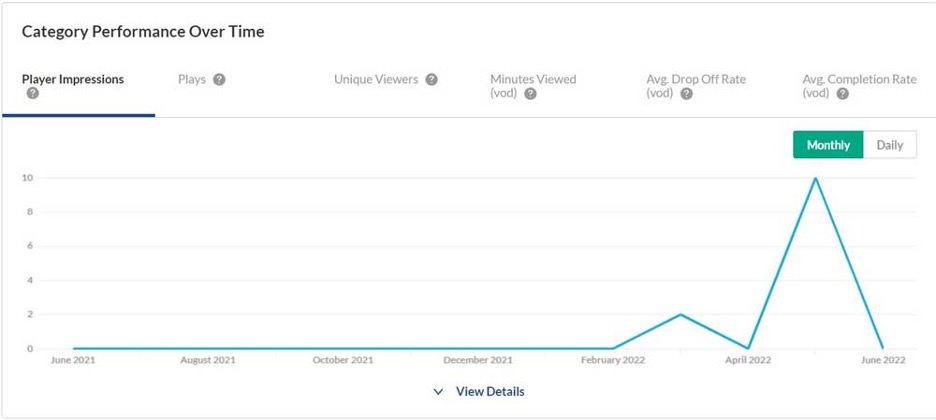
Category Performance Over Time
Visualizes metrics from Highlights as line graphs. Includes:
- Avg. Drop Off Rate (VOD) – Average rate of viewers who didn’t finish the video
- Avg. Completion Rate (VOD) – Average rate of viewers who watched the entire video
You can toggle between Monthly and Daily views and click View Details for deeper insights.
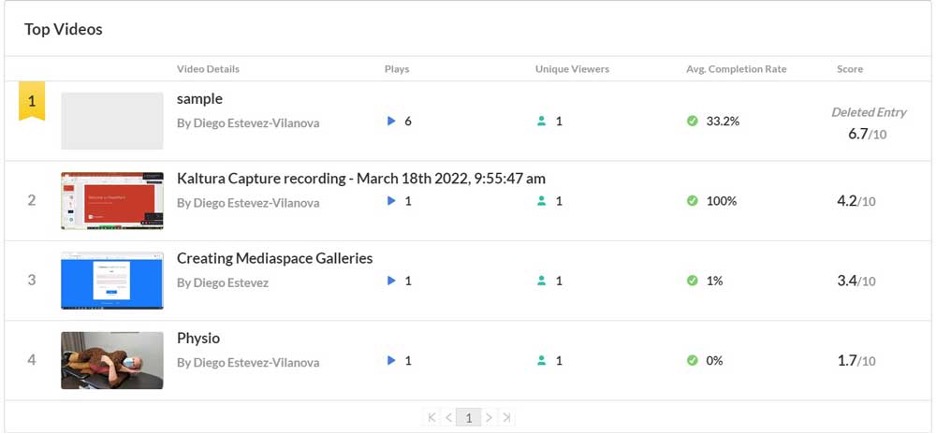
Top Videos (Extended)
Displays top-performing videos based on plays and algorithmic score. Use pagination to view more.
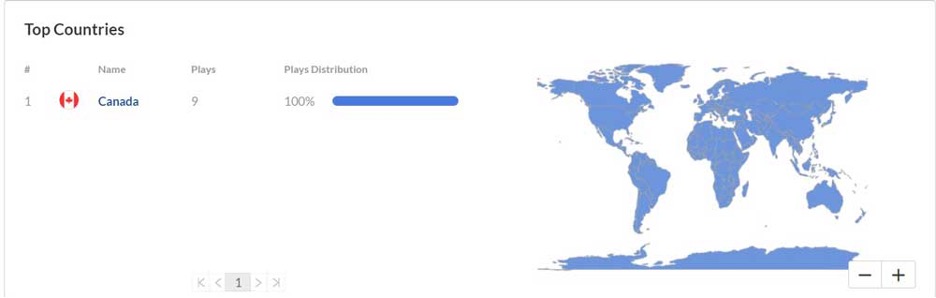
Top Countries
Shows countries where entries were played. Click to drill down into regions and cities.
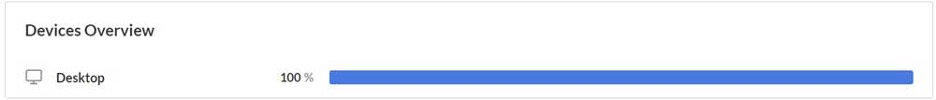
Devices Overview
Displays the distribution of devices used to view media.
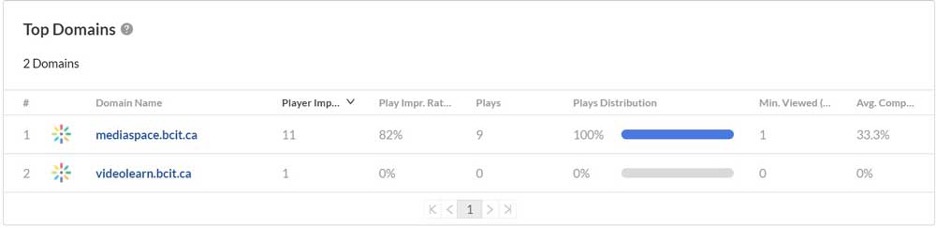
Top Domains
Tracks the domain names where entries were viewed (e.g., mediaspace.bcit.ca, videolearn.bcit.ca).
Related Posts
