


- Resource
- Uncategorized
- Kaltura Media Gallery – Analytics
Kaltura Media Gallery – Analytics
Kaltura Analytics Tools
The metrics shown in this tool apply only to Learning Hub course Media Galleries.
If you are looking to see data related to individual Kaltura video entries that you have created or own, please see Kaltura My Media – Entry Analytics.
Conversely, if you are interested see the data for all of your created/owned entries combined, please see Kaltura My Media – My Analytics.
Kaltura Media Gallery analytics provides valuable insights into a course Media Gallery. These insights include: user engagement, geographic distribution, and the devices used for viewing.
To view these analytics, access Kaltura Media Gallery inside a Learning Hub course first, then click Actions and Analytics from the top right.

Media Gallery Analytics Dashboard
The analytics dashboard for your course Media Gallery enables you to track overall activity, compare time periods, and apply filters for tags and media type.

Filtering Analytics
To change the timeframe for or filter any of the data, use the date picker and filter at the top of the dashboard. See Kaltura – Filtering Analytics.
Analytics Terminology
Please use the following as a reference for any of the terms mentioned below: Kaltura – Analytics Terminology
Details
At the top of the dashboard, you can see the following details: Parent, ID, Sub-categories, Creation Date and Last Update. This information is fixed and not applicable for most instructors or staff. However, it is good to note the ID number should you require technical support with your course Media Gallery.

Highlights
The highlights section displays a snapshot of the important metrics for the selected timeframe. For each viewer you will see:
- Player impressions – How many times the media was loaded onto a webpage, regardless of whether the user clicked Play or not.
- Plays – Number of times a Play button was pressed.
- Unique viewers – Number of unique viewers (typically students) that had an active viewing action during the time period. Note that Player Impressions are not counted as a viewing action.
- Minutes viewed (VOD) – Minutes played across all viewers.
- Contributors – Number of users who created media and published it into the gallery.

Click See Details to jump to the Category Performance Over Time graph with all the metrics for the selected time frame.
Category Page Views
This section displays the views from the ‘category page’ (the Media Gallery) compared to all views, this includes views from the same video which may have also been embedded elsewhere inside the course using one of the Kaltura Browse and Embed tools or from outside of the course.
You can see from the example that about half of the plays are within the context of the category (i.e. come from inside the specific course media gallery), and the rest of the plays are out of context, perhaps viewed as an embeded video inside or outside this course using Kaltura BSE.

Top Videos
The top videos are selected based on a unique algorithm that takes into consideration parameters such as the number of plays, unique viewers, and average completion rate, and scores them in comparison to other videos. Click See Details to display the Top Videos panel.

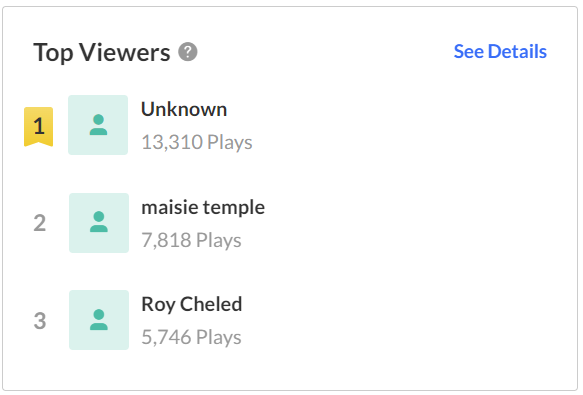
Top Viewers
Top Viewers displays the users based on the highest number of plays. Click See Details to open the Users and Dates metrics (see below).
Insights
Under Insights, you can find snapshots of information about users, such as what devices they are using most frequently or where they are geographically located.
Most Viewed Domain – This will normally be learn.bcit.ca which is the default domain for most Kaltura applications used inside the Learning Hub.
Most Popular Devices – This will display the most used device viewers watch videos on. Click See Details to jump to the metrics for Devices Overview.

Top Locations – This will display the country with the most video views. Click See Details to jump to the metrics for Top Countries.

Category Performance Over Time
In this graph you can see:
- Player impressions (default) – A player impression event is counted each time a Kaltura video player is loaded on a webpage from a user’s prespective.
- Plays – A play is counted when a user clicks the Play button to watch a video.
- Unique viewers – Number of unique users that had an active viewing action. Note that Player Impressions are not counted as a viewing action.
- Minutes viewed (VOD) – Total number of playback minutes played by the viewers, based on quartile milestones. Example: If a user watched 4 minutes from a 10-minute video it will be calculated as 2.5 minutes (25% milestone).
- drop off rate (VOD) – The average percentage of drop-off quartile (last quartile watched), across all plays. Example: If a user once watched 20% of the video and the second time watched 80% of the video, the calculation will be: (0+75)/2 plays = 37.5% Avg. Drop Off Rate. 20% is calculated as 0 since the user didn’t reach the 25% milestone and 80% is calculated as 75% as the user passed the 3rd quartile milestone.
- Avg completion rate (VOD) – Average percentage of completion, across all plays. Example: If a user once watched 20% of the video and the second time watched 80% of the video, the calculation will be:(20+80)/2 plays = 50% Avg. Completion Rate.
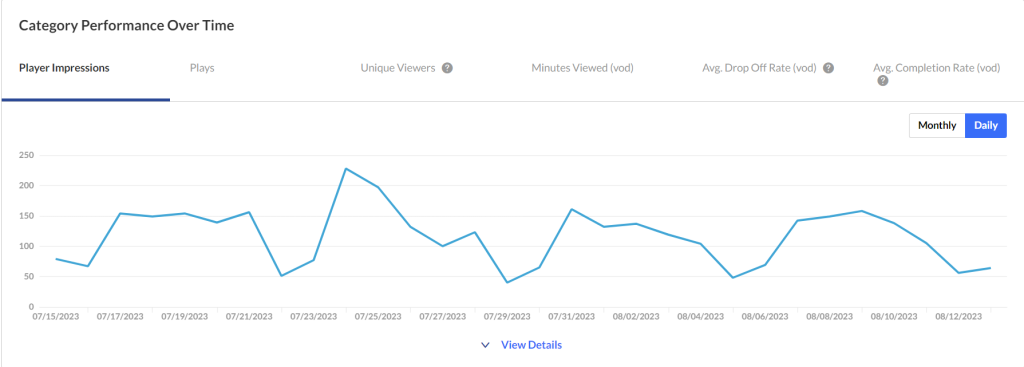
Click the Monthly / Daily buttons at the far right to view the data for each metric in more granularity. You can also hover over any point in the graph to see the detailed data.

Click View Details at the bottom of the graph to display and expand the graph for the various metrics available.
Users
Select Users from the drop-down menu. A list of users and their metrics is displayed.
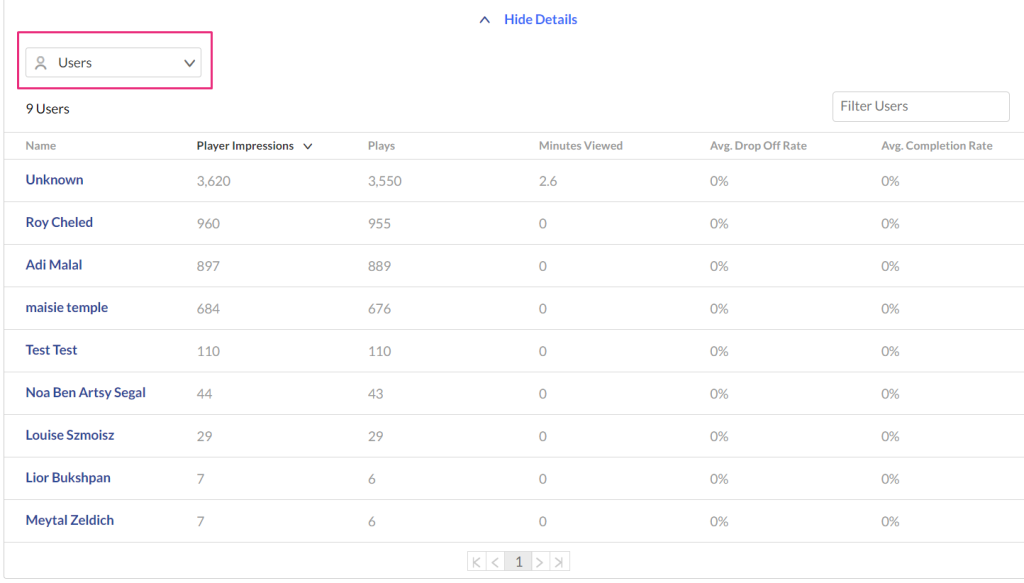
Click on a user to see the metrics for the selected user.

Dates
You can view the data for each metric in daily or monthly granularity. Hover over any point in the graph to see the detailed data. You can also compare to another metric by selecting an additional metric from the drop-down list.
To change the time period or filter the data, use the date picker and filter panel at the top of the dashboard. You can also compare data from different time periods, see Kaltura – Filtering Analytics for more details.

Top Videos
The Top Videos data displays the following information for the Media Gallery:
- Video Details – You can click on the video name to display a drop down with more information about that video.
- Plays – A play is counted when a user clicks the play button to watch a video.
- Unique viewers – Number of unique users that had an active viewing action during the time period. Note that Player Impressions are not counted as a viewing action.
- Avg completion rate (VOD) – Average percentage of completion, across all plays. Example: If a user once watched 20% of the video and the second time watched 80% of the video, the calculation will be:(20+80)/2 plays = 50% Avg. Completion Rate.
- Score – You can see how successful the video has been in comparison to other videos.

Top Countries
The Top Countries panel ranks the geographical distribution by plays. The heatmap shows the countries; the darker the shade, the more plays for that country. For each country the following metrics are available:
- Plays – A play is counted when a user clicks the play button to watch a video.
- Plays Distribution – Number of plays divided by the total number of plays in the selected timeframe.

You can drill down to region by selecting a country on the map, then select a region to drill down to cities.

Devices Overview
In this panel, the Devices Overview graph displays the distribution of devices usage by plays. You can see on which device viewers watched the entry.

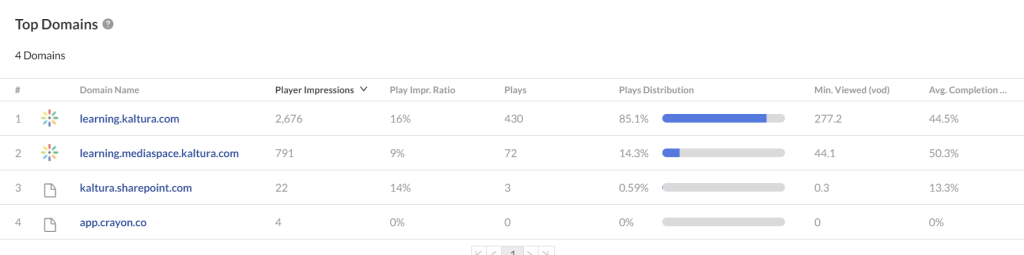
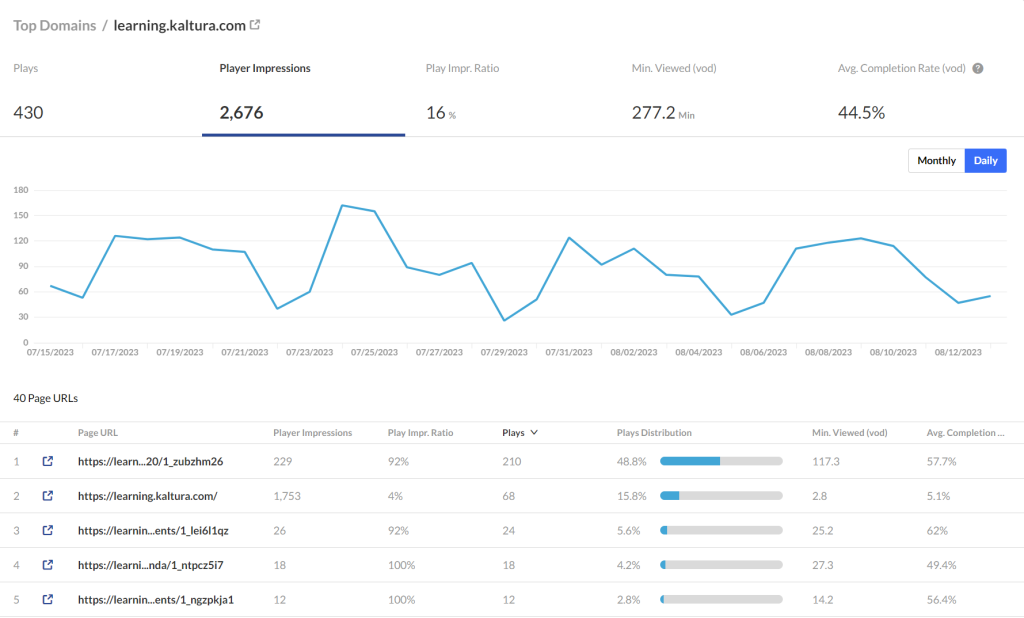
Top Domains
In this panel, the top domains are ranked by the domains that had the most plays in the selected time frame. For each domain the following metrics are available:
- Player impressions – A player impression event is counted each time the player is loaded on the page.
- Player impression ratio – The number of plays divided by number of impressions.
- Plays – A play is counted when a user clicks the play button to watch a video.
- Plays Distribution – Number of plays divided by the total number of plays in the selected timeframe.
- Minutes Viewed (VOD) – Total number of playback minutes played by the viewers, based on quartile milestones. Example: If a user watched 4 minutes from a 10-minute video it will be calculated as 2.5 minutes (25% milestone).
- Average completion rate (VOD) – Average percentage of completion, across all plays. Example: If a user once watched 20% of the video and the second time watched 80% of the video, the calculation will be: (20+80)/2 plays = 50% Avg. Completion Rate.
You can also drill down to a specific domain to see all the URLs under that domain and the same metrics in a more granular view.

You can view the data for each metric in daily or monthly granularity. Hover over any point in the graph to see the detailed data. Click on the title of the metric in the table to sort the table based on this metric.
Related Posts
