


- Resource
- Uncategorized
- Kaltura My Media – Entry Analytics
Kaltura My Media – Entry Analytics
Kaltura Analytics Tools
The metrics shown in this tool apply only to individual video entries inside Kaltura My Media.
If you are interested see the data for all of your created/owned entries combined, please see Kaltura My Media – My Analytics.
If you are looking to see data related to video entries published into a course Media Gallery, please see Kaltura Media Gallery – Analytics
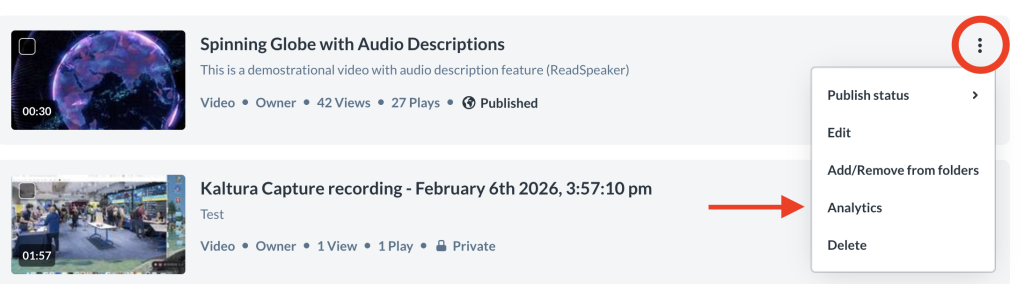
The Entry Level Analytics tool displays statistical information about individual Kaltura entries viewed from inside My Media. To view analytics for a specific entry, click the ellipses beside an entry and choose Analytics from the dropdown menu.
This tool is comprised of the following components:
- Highlights
- Social Highlights
- Engagement Per user
- Video performance over time
- How player impressions lead to engagement
- Top Countries
- Devices Overview
- Top Domains
- Video Quiz Components
Filter Analytics
You can filter all the metrics shown below by specific dates or metrics. Please see the following job aid titled Kaltura – Filtering Analytics
Analytics Terminology
Please use the following as a reference for any of the terms mentioned below: Kaltura – Analytics Terminology
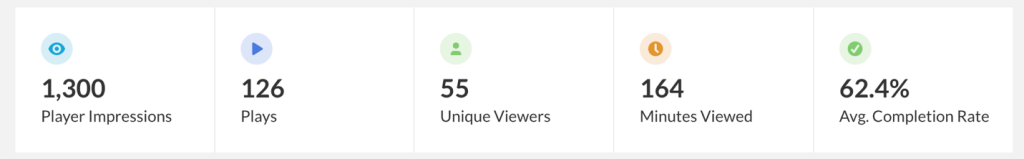
Highlights
The Highlights component displays five important metrics for the selected timeframe. These include:
- Player Impressions – A player impression event is counted each time a Kaltura media player is loaded into a webpage
- Minutes Viewed – The cumulative number of minutes that the entry has been watched.
- Plays – The cumulative number of times users have clicked on the play button for the entry.
- Unique Viewers – The number of viewers that have watched an entry with a unique BCIT student or employee (A#) number.
- Completion Rate – A percentage score is determined by the number of Plays divided by the number of Unique Viewers (Plays ÷ Unique Viewers)
Social Highlights
The Social Highlights component shows the number of times an entry has been shared via a shared link.

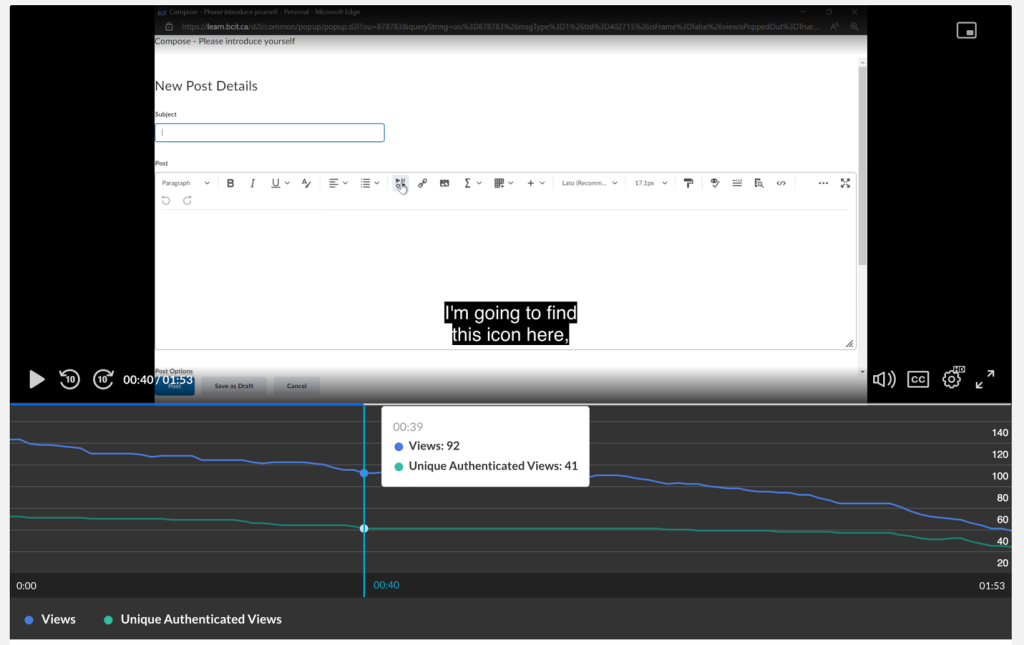
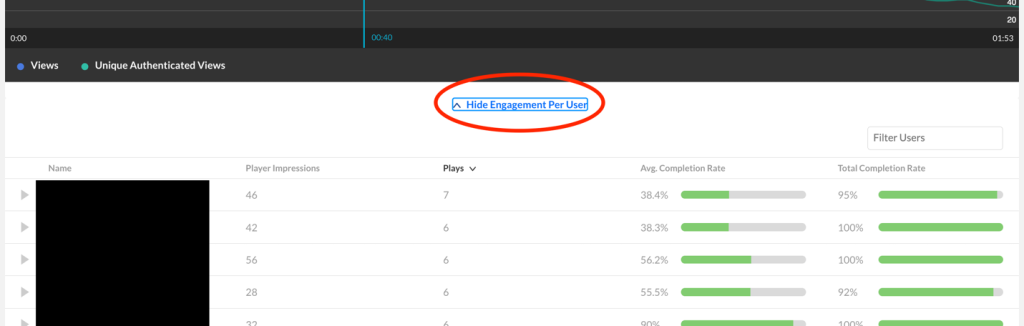
Engagement Per user
This component will track the number of views and authenticated views for the entry as well as the average retention time. This is displayed visually on a chart where you can see each metric.
You can click on View/Hide Engagement Per User to reveal the username of each viewer and see information specific to that user.
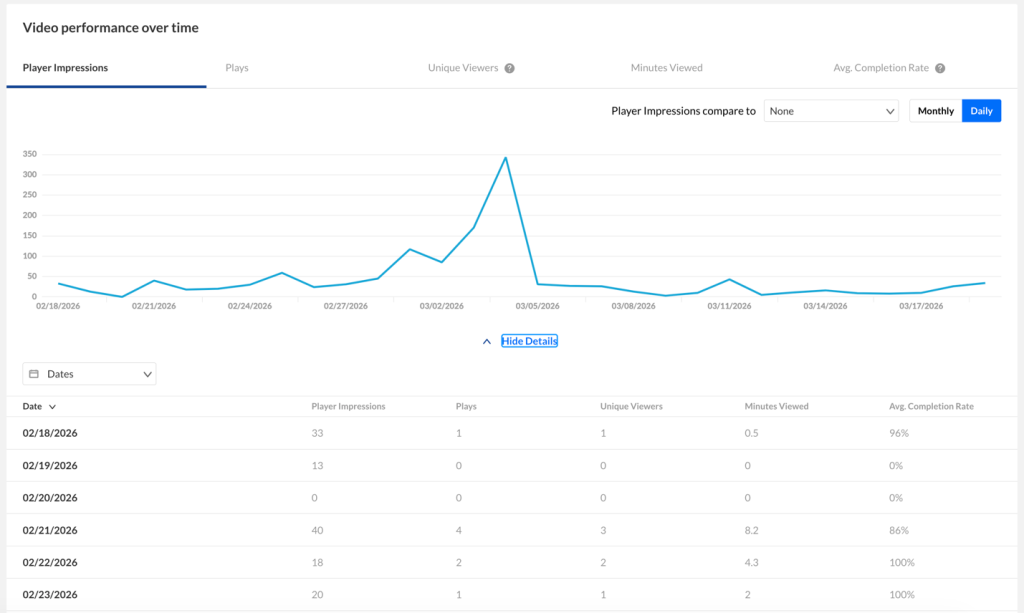
Video performance over time
The Video Performance Over Time component visually represents the metrics shown in the Highlights component as line graphs. Included with them is the Avg. Drop Off Rate metric which creates a percentage scored based on the total number of individuals who watched the entry divided by the number of individuals who did not watch the entry all the way.
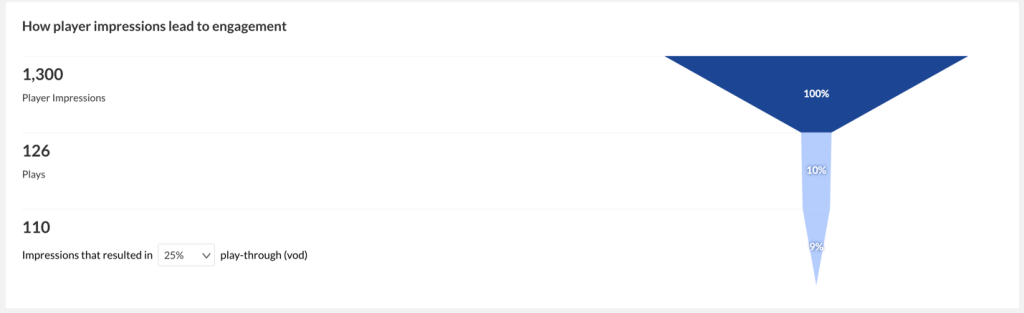
How player impressions lead to engagement
This component shows a pyramid graph that outlines the total number of times the entry has been embedded onto a webpage. It also displayed the percentage of those embeds that result in users clicking the play button and watching the entry for a specified duration.
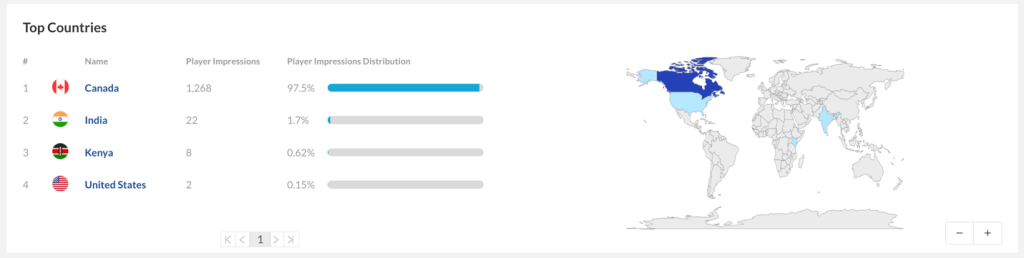
Top Countries
This component displays the countries where the entry has been played at least once. Click on the country name to see the number of plays associated with specific regions of that country. Click on a region to see the number of plays associated with a specific cities in that region.
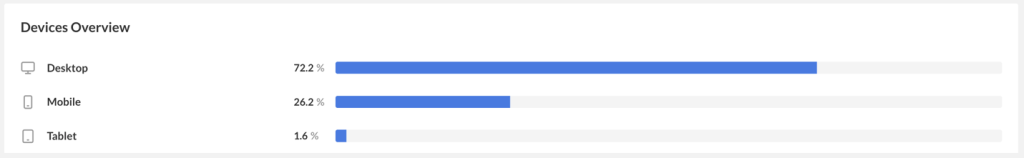
Devices Overview
This component displays the distribution of devices that the entry has been viewed on.
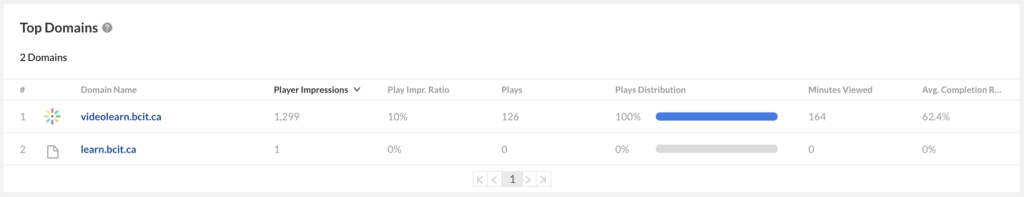
Top Domains
This component tracks the domain from where this entry has been viewed. This will normally be either videolearn.bcit.ca, learn.bcit.ca or other.
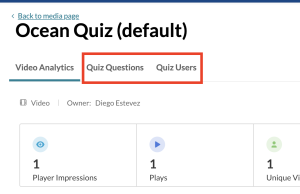
Video Quiz Components (Kaltura Quizzes Only)
If the entry you are currently looking at is a Video Quiz then you will have access to two additional sets of tabs: Quiz Questions and Quiz Users.
For information about this and Kaltura Quiz Analytics please see the following Job: Kaltura Quiz – Analytics and Reporting
Related Posts
